Key points:
- The most expensive international education worldwide can be found in Asia, particularly in China.
- Beijing, Shanghai and Zurich are the top three most expensive cities for international schools.
- The Middle East and Africa are the cheapest areas in the world for international education.
At the International Schools Database, we help local and expat parents choose the perfect international school for their children. Our database allows parents to find, research and compare international schools in cities across four continents. Naturally, this means that we gather and analyse a huge amount of information about international schools all over the world.
Our latest research project uses this data to evaluate the prices of international schools across the globe. We have compiled price data at regional levels for Asia, Africa, the Middle East and Europe, along with worldwide price trends in this article.
Below, we have analysed the worldwide price data from 56 cities in 52 countries, in graph and table forms. While we have used all price data available to us, there may be additional schools and prices not included in each city. This is because they do not make their price data available or because it is unknown to us. Links to additional research focusing in each of the regions individually can be found at the bottom of this article, and here can be found the updated research for 2020, the updated research for 2021 and the updated research for 2022.
Worldwide Prices of International Schools Per Year
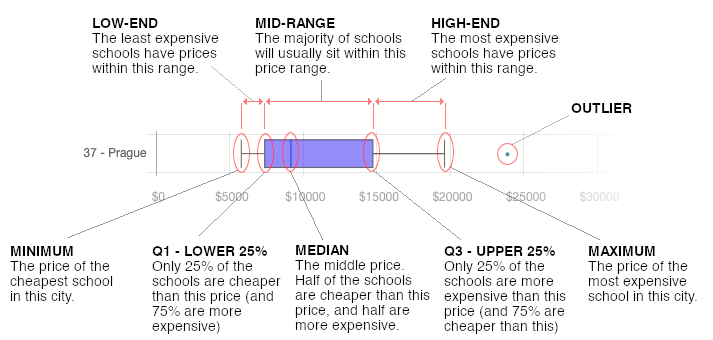
The graph below is known as a box plot graph. It shows a comprehensive view of the range of prices in each city, instead of just an average. A single average price may not necessarily represent the full picture of prices in each destination. Since there is a lot to unpack in this graph, we have also provided a little explanation on how to read the graph easily at the end of the article.
Highlights and takeaways from the research findings
The most expensive schools worldwide can be found in Asia, particularly in China. Only one Asian city - Cambodia’s Phnom Penh - offers prices for under $2,000 per year, while Beijing and Shanghai have the second and third most expensive maximum prices on the planet at $41,389 and $38,853 per year. Kyoto-Osaka-Kobe takes the first spot at $48,575 per year.
In Beijing alone, there is over $33,000 in the difference between the cheapest and most expensive schools. Shanghai has an even wider range of $4,830 to $38,853, giving them the advantage of catering to parents on a wide spectrum of income level.
In stark contrast, Africa offers some of the cheapest minimum prices in the world for international education; 4 of the 10 cheapest cities in our research are African. In fact, Uganda’s capital Kampala is home to the least expensive price worldwide, at just $523 per year.
Even more affordable in general is the Middle East, which has five cities in the cheapest top 10; Manama at $1,003 per year, Kuwait City at $1,241, Doha at $1,250, Riyadh at $1,675, and Dubai at $2,317.
However in the Middle East in particular, there is a big range of prices in all cities included in our research due to the high numbers of international schools available. So while their minimum prices may seem cheap, their maximum prices could be considered quite high, which in turn raises the average prices.
As for Europe, certain cities offer very good (relative) affordability. In Madrid, you can expect to pay a maximum of $15,095 per year according to our data, while in Malaga the maximum price drops to $10,471 - the cheapest on the continent by a significant margin, and the second cheapest maximum price in the world.
Switzerland is China’s closest rival at the expensive end of the scale. Zurich takes the top spot in Europe and third in the world with prices ranging from $8,052 per year $31,406.
In one third of the European cities included in our study, the median price sits between $9,000 and $11,000. Paris, the city with the widest range of prices and the third highest maximum price, is included in this. So while school prices in Europe do reach the top end of the scale in some countries, the ‘ballpark’ price on the continent as a whole can be lower than in other regions.
You can find a breakdown of exact prices for each city in the table below. But if you’d like even more analysis, we have also compiled price data by region; you can find links to this additional research at the bottom of this article. If you require any further information or have additional questions, don't hesitate to contact us at andrea@international-schools-database.com.