Key points:
- There is a stark divide in the costs of international schools between North America and Central/South America. Median prices jump almost 500% between the least expensive city (Lima in South America) and the most expensive city (New York City in North America).
- Toronto remaining the least expensive city in North America for international school costs for the second year in a row.
- Of the 3 South and Central American cities included in our analysis all are very close together when it comes to prices.
- Within North America, a further divide exists between New York City, the most expensive city for international school costs in the region, and all other North American cities included in our research. International school prices are over 30% higher in NYC than in the second most expensive city (San Francisco Bay Area).
At the International Schools Database, we help local and expat parents choose the perfect international school for their children. Our database allows parents to find, research and compare international schools around the world. Naturally, this means that we gather and analyse a huge amount of information about international schools.
Starting in 2019, we began using this data to evaluate the prices of international schools across the globe. In this article, we share and analyze the prices of international schools in the Americas updated to 2022.
Below, we have analysed price data from 7 cities in 5 countries in the Americas, in graph and table forms. While we have used all price data available to us as of Dec 31st 2022, there may be additional schools and prices not included in each city. This is because do not make their price data available or because it is unknown to us. Links to additional research focusing on each world region individually and globally can be found at the bottom of this article and here can be found the results of the previous year 2021.
Prices of International Schools in the Americas, Per Year
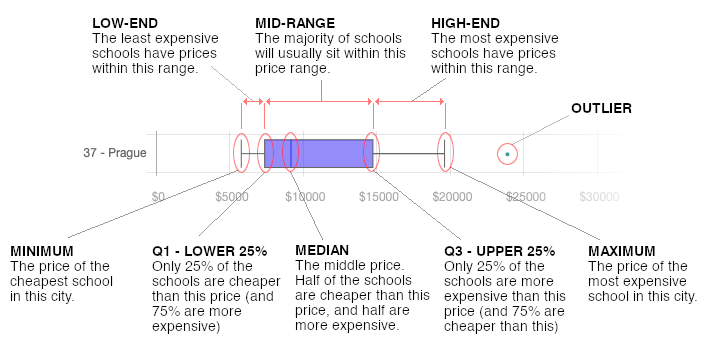
The graph below is known as a box plot graph. It shows a comprehensive view of the range of prices in each city, instead of just an average. A single average price may not necessarily represent the full picture of prices in each destination. Since there is a lot to unpack in this graph, we have also provided a little explanation on how to read the graph easily at the end of the article.
Highlights and takeaways from the research findings
The cost of international schools in the Americas has two very different sides to its story. On the one hand, North America is home to the most expensive city in the world for international schooling – New York City, where prices can exceed $60,000 per year at the top end of the scale. On the other side, Lima is this year the least expensive city in the Americas for international schools. With a maximum price of just over $16,000 per year, the difference between the two is staggering.
Even within the United States, there is a further divide between New York City and everywhere else. While nowhere in the US comes anywhere close to the prices seen in South and Central America, the median price of international schools in Chicago is less than half what it is in the ‘Big Apple’, and in San Francisco Bay Area prices are over one third cheaper.
Toronto offers the best value for money in North America and is the least expensive city for international schools in the region. In fact, prices in the city have decreased slightly since last year at all points on the scale – minimum, median and maximum. If you are planning a move to North America, it may be worth considering Canada as an option.
Of the three cities in South and Central America included in our analysis, all are remarkably close in price range. Median costs range from just above $8,000 in Lima to above $11,000 in Panama City. While the region offers clear value for money globally, median prices in every city we analysed (Lima, Panama City and San Jose) did increase slightly from last year.
You can find a breakdown of exact prices for each American city in the table below. But if the Americas isn’t enough, we have also compiled price data for other regions and cities around the world; you can find links to this additional research at the bottom of this article. If you require any further information or have additional questions, don't hesitate to contact us at andrea@international-schools-database.com.