Home > Articles

New research reveals the cost of international education around the world in 2025

Key points:

  • The most expensive cities in the world for international schools were located in 3 areas: the USA, China, and Europe
  • Europe and Asia had the widest range of international school costs in 2025
  • African cities had 4 of the lowest median costs in the world for international schools
  • The Middle East was the only world region that was not included in either the 10 most expensive or the 10 least expensive cities for international schools

At the International Schools Database, we help local and expat parents choose the perfect international school for their children. Our database allows parents to find, research and compare international schools in cities across the world. Naturally, this means that we gather and analyse a huge amount of information about international schools.

Starting in 2019, we began using this data to evaluate the prices of international schools across the globe. We are now in our sixth year of this project, and we have been able to pinpoint certain price facts such as the most expensive regions, the regions with the biggest variety of prices, and more.

Below, we have analysed the worldwide price data from 86 cities in 52 countries, in graph and table forms. While we have used all price data available to us as of Dec 31st 2025, there may be additional schools and prices not included in each city. This is because they do not make their price data available or because it is unknown to us. Links to additional research focusing on each world region individually can be found at the bottom of this article and here can be found the results of the previous year 2024.

Worldwide Prices of International Schools Per Year

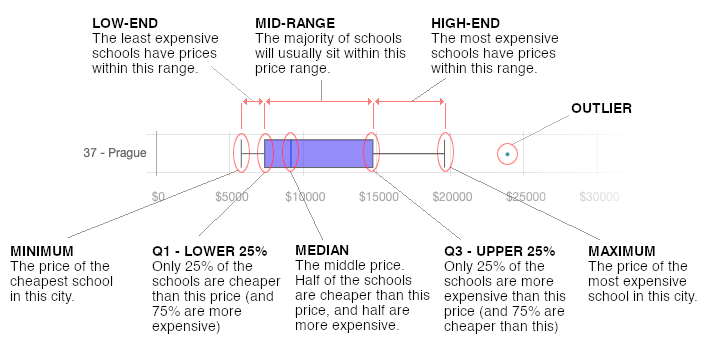
The graph below is known as a box plot graph. It shows a comprehensive view of the range of prices in each city, instead of just an average. A single average price may not necessarily represent the full picture of prices in each destination. Since there is a lot to unpack in this graph, we have also provided a little explanation on how to read the graph easily at the end of the article.

How to read this graph

Highlights and takeaways from the research findings

When it comes to the most expensive international school costs in the world in 2025, there are three locations to take note of: the USA, China, and Europe. The 10 most expensive cities for international schooling in our research were all within these regions. Two of those cities were in the USA - New York, which was the most expensive in the world, and the San Francisco Bay Area. The median cost of an international school in New York in 2025 was $47,950 (costs there had a maximum of $72,300) and in San Francisco it was $36,772.

Four more of the top 10 cities were in China; specifically Beijing, Shanghai, Shenzhen and Guangzhou. Of these, Beijing had the highest median cost in China for international schooling and the second highest in the world. The median cost for an international school in the city in 2025 was $38,078.

The remaining four European cities in the top 10 were in Switzerland and the United Kingdom; specifically Zurich-Zug, Lausanne-Vaud, Geneva, and London. In Europe, Zurich-Zug was the city with the highest median cost of international schools at $35,472. That makes it the fourth highest median cost in the world in 2025 for international schooling.

While Europe and Asia had some of the most expensive international school costs in the world in 2025, they were also represented among the top 10 least expensive cities. Denmark and Spain had the lowest median international school costs in Europe - $5,991 in Copenhagen, Denmark’s capital city, and $5,896 in Tenerife, one of Spain’s Canary Islands.

As for Asia, some of the least expensive international school costs both in the continent and the world were found in Malaysia, Indonesia and Cambodia. Ipoh-Perak in Malaysia was the city with the lowest median cost of international schools worldwide - $3,426 in 2025. The other Asian cities with some of the lowest median costs were Kuala Lumpur, Bali, and Phnom Penh. This shows that there is a very broad range of costs across these regions.

Africa was the only world region where the median costs of international schools did not exceed $10,000 per year in 2025. In fact 4 of the 10 lowest median costs in our research were in Africa - Casablanca in Morocco, Cape Town in South Africa, Mauritius, and Kampala in Uganda. Of these, Kampala had the lowest median cost for an international school at $4,153 - making it the second lowest in the world.

The Middle East is the only world region whose cities were not among either the most or least expensive for median international school costs. Like its name, costs in this region were spread throughout the middle range. Istanbul had the 11th highest median cost of 86 cities included in our research ($24,482 in 2025), while Amman was 73rd of 86 cities with a median cost of $6,559 for international schooling.

You can find a breakdown of exact prices for each city in the table below. But if you’d like even more analysis, we have also compiled price data by region; you can find links to this additional research at the bottom of this article. If you require any further information or have additional questions, don't hesitate to contact us at andrea@international-schools-database.com.

Prices of International Schools Per Year

Rank City Minimum Q1 Median Q3 Maximum
1 New York City $28,450 $42,500 $47,950 $61,211 $72,300
2 Beijing $14,362 $30,550 $38,078 $42,032 $43,643
3 San Francisco Bay Area $15,394 $31,138 $36,772 $41,868 $52,000
4 Zurich - Zug $10,276 $33,092 $35,472 $39,483 $42,228
5 Lausanne - Vaud $20,730 $22,810 $34,941 $37,584 $58,864
6 Shanghai $10,662 $22,269 $33,245 $45,715 $49,574
7 Shenzhen $14,645 $21,734 $33,215 $35,002 $50,101
8 London $4,353 $20,619 $29,876 $38,050 $54,674
9 Geneva $16,316 $25,228 $28,808 $34,152 $37,494
10 Guangzhou $12,474 $19,771 $27,094 $34,387 $38,921
11 Istanbul $2,725 $7,475 $24,482 $39,863 $47,550
12 Vienna $8,389 $11,873 $22,846 $27,927 $30,805
13 Singapore $6,226 $16,397 $22,803 $29,890 $43,494
14 Brussels $9,069 $16,308 $22,532 $27,982 $47,716
15 Chicago $6,444 $15,749 $22,320 $30,563 $38,400
16 Riga $9,731 $10,911 $21,001 $22,057 $23,406
17 Seoul $5,614 $16,386 $20,447 $24,346 $36,126
18 Hong Kong $2,809 $17,746 $20,286 $25,182 $40,445
19 Astana $9,066 $16,237 $19,591 $21,250 $24,102
20 Toronto $10,900 $15,967 $19,489 $29,895 $33,188
21 Hanoi $4,287 $15,199 $18,910 $23,543 $31,940
22 French Riviera - Côte d'Azur $11,029 $11,955 $17,596 $23,482 $45,170
23 Budapest $6,570 $8,588 $17,262 $20,295 $28,100
24 Bucharest $9,140 $10,706 $16,573 $20,397 $31,725
25 Lisbon $6,397 $11,146 $15,853 $17,444 $21,119
26 Frankfurt am Main $5,690 $9,239 $15,751 $18,011 $30,288
27 Paris $3,063 $10,657 $15,511 $21,450 $40,595
28 Milan $3,226 $8,882 $15,487 $19,881 $23,805
29 Taipei $12,006 $13,816 $15,463 $17,902 $29,787
30 Bratislava $7,086 $11,122 $14,930 $20,588 $32,851
31 Bangkok $3,212 $8,809 $14,482 $20,891 $30,983
32 Athens $6,827 $10,653 $14,079 $14,903 $16,390
33 Tokyo $363 $10,148 $13,916 $18,149 $22,389
34 Manila $2,307 $7,274 $13,800 $16,363 $22,300
35 Warsaw $8,802 $11,280 $13,212 $18,957 $30,203
36 Prague $5,533 $10,393 $12,510 $20,208 $32,717
37 Monterrey $7,100 $11,184 $12,352 $12,474 $18,332
38 Berlin $3,520 $8,359 $12,319 $14,352 $22,057
39 Rome $2,347 $9,374 $12,319 $20,532 $23,817
40 Dammam Metropolitan Area $8,533 $10,969 $12,198 $16,164 $24,532
41 Ho Chi Minh City $5,122 $9,356 $12,159 $19,056 $26,757
42 Dubai - Sharjah - Ajman $1,443 $6,305 $11,918 $15,594 $31,581
43 Kraków $9,651 $9,927 $11,581 $16,544 $20,644
44 Pattaya $2,289 $5,853 $11,165 $16,177 $21,876
45 Sofia $7,062 $9,245 $11,146 $15,780 $30,155
46 Rotterdam - The Hague $4,986 $8,368 $11,064 $25,283 $32,253
47 Madrid $5,338 $7,732 $10,794 $12,235 $20,291
48 Mallorca $7,509 $9,855 $10,625 $11,439 $13,874
49 Barcelona $5,843 $9,460 $10,577 $15,598 $23,250
50 Kyoto - Osaka - Kobe $5,368 $7,261 $10,485 $13,027 $20,360
51 Doha $1,311 $7,703 $10,348 $12,889 $20,743
52 Jeddah $4,581 $7,345 $9,901 $13,973 $19,392
53 Riyadh $2,160 $5,866 $9,866 $13,473 $27,998
54 Malaga - Costa del Sol $5,666 $7,747 $9,621 $10,765 $17,575
55 Vilnius $7,040 $8,623 $9,461 $13,962 $23,658
56 Phuket $4,892 $8,764 $9,384 $10,329 $22,461
57 Chiang Mai $5,212 $7,815 $9,360 $11,761 $16,627
58 Lima $5,402 $8,039 $9,052 $13,257 $18,150
59 Panama City $6,700 $8,300 $9,048 $15,276 $19,293
60 Baku $5,230 $7,923 $9,017 $9,769 $26,000
61 Abu Dhabi $2,804 $7,428 $8,984 $13,773 $22,300
62 Kuwait City $1,227 $7,244 $8,796 $11,481 $18,387
63 Limassol $6,101 $7,708 $8,776 $10,325 $14,666
64 Nairobi $1,858 $5,377 $8,633 $14,814 $34,090
65 Muscat $1,196 $5,916 $8,583 $10,989 $23,459
66 Algarve $6,142 $7,626 $8,381 $9,656 $12,788
67 Alicante - Costa Blanca $2,171 $6,394 $8,359 $10,770 $12,425
68 Valencia $3,637 $6,252 $7,410 $8,729 $10,543
69 Penang $3,899 $6,391 $7,314 $8,111 $9,370
70 Amsterdam $4,728 $5,749 $7,069 $23,230 $35,069
71 Johannesburg $1,347 $5,338 $6,699 $8,083 $31,348
72 Manama $1,107 $3,950 $6,660 $10,116 $24,912
73 Amman $3,075 $5,669 $6,559 $9,029 $17,770
74 Porto $5,702 $6,032 $6,419 $11,381 $13,111
75 Koh Samui $3,846 $4,539 $6,299 $7,380 $14,786
76 Johor Bahru $4,181 $5,360 $6,197 $18,035 $29,093
77 Casablanca $3,899 $4,809 $6,108 $13,775 $15,021
78 Kuala Lumpur $2,720 $4,670 $6,104 $9,483 $28,842
79 Copenhagen $4,349 $4,757 $5,991 $6,704 $23,708
80 Bali $1,057 $4,177 $5,980 $7,722 $13,888
81 Tenerife $4,376 $5,060 $5,896 $6,512 $7,438
82 Phnom Penh $1,720 $4,350 $5,450 $8,021 $24,190
83 Cape Town $2,807 $4,246 $4,566 $5,625 $11,862
84 Mauritius $2,615 $3,554 $4,407 $6,190 $7,109
85 Kampala $1,646 $2,700 $4,153 $8,350 $25,900
86 Ipoh - Perak $2,594 $3,098 $3,426 $3,790 $4,322

source: www.international-schools-database.com

How to read the graph

The purple box shows the middle portion of the data, known in statistical lingo as the Interquartile Range. This is the ‘ballpark’ range that you would usually expect to pay in that particular city. The horizontal lines at each end of the box represent the First Quartile (Q1) and Third Quartile (Q3). These are the prices that would be considered somewhat cheaper (for Q1) or more expensive (for Q3) than the norm.

The median is shown as a vertical bar in the centre of the box. This is the price of the school in the exact middle of the range, i.e. the half-way point. Finally, you’ll see dots next to some of the box plots. These are ‘outliers’, prices that sit outside of all of the above ranges.

⇧ Go back to the graph ⇧

Additional research for other regions: