Key points:
- The 4 most expensive cities in Asia for international schools in 2025 were all in China
- Asia had the widest range of costs for international schools in the world
- Thailand has the largest choice of cities and costs for international schools in Asia
- Malaysia had the lowest international school costs in Asia and the world in 2025
At the International Schools Database, we help local and expat parents choose the perfect international school for their children. Our database allows parents to find, research and compare international schools around the world. Naturally, this means that we gather and analyse a huge amount of information about international schools.
Starting in 2019, we began using this data to evaluate the prices of international schools across the globe. In this article, we share and analyze the prices of international schools in Asia updated to 2025.
Below, we have analysed price data from 25 cities in 13 Asian countries, in graph and table forms. While we have used all price data available to us as of Dec 31st 2025, there may be additional schools and prices not included in each city. This is because they do not make their price data available or because it is unknown to us. Links to additional research focusing on each world region individually and globally can be found at the bottom of this article and here can be found the results of the previous year 2024.
Prices of International Schools in Asia, Per Year
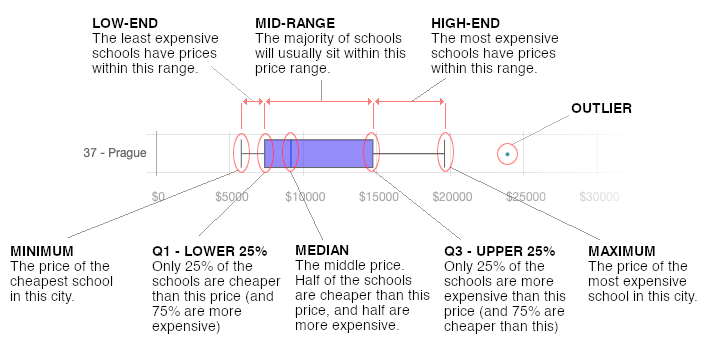
The graph below is known as a box plot graph. It shows a comprehensive view of the range of prices in each city, instead of just an average. A single average price may not necessarily represent the full picture of prices in each destination. Since there is a lot to unpack in this graph, we have also provided a little explanation on how to read the graph easily at the end of the article.
Highlights and takeaways from the research findings
In 2025 China had the highest costs for international schools in Asia, with the four most expensive cities in the continent all within its borders. Those cities were Beijing - which had the highest median cost in Asia and the second highest in the world - Shanghai, Shenzhen and Guangzhou. If you plan to send your child to an international school in any of those cities, the median costs in 2025 ranged from $27,094 in Guangzhou to $38,078 in Beijing.
However, when we look at the cost of international schools across Asia as a whole, the picture is quite different. The median cost of international schooling in 2025 across the continent ranged from $3,426 in Ipoh-Perak, Malaysia, to $38,078 in Beijing. So, when looking at median costs alone, international schools in Malaysia were more than ten times cheaper than those in China. That’s the largest difference in lowest and highest median costs of any world region in 2025.
Even within countries in Asia however, a broad range of international school costs can be seen. In Thailand for example the median cost in Koh Samui, the cheapest city for international schools in the country, was $6,299. In Bangkok however - the most expensive city - the median cost was more than double that of Koh Samui at $14,482. In between were Pattaya ($11,165), Phuket ($9,384) and Chiang Mai ($9,360). This represents both the widest range of costs and the most choice of cities for international schools (five) in Asia.
While Thailand’s international school costs may be considered mid-range when looking at Asia as a whole, Malaysia leans more towards the lower end of the scale. All four Malaysian cities included in our research (Penang, Johor Bahru, Kuala Lumpur, and Ipoh-Perak) had among the 10 lowest median costs in Asia. Ipoh-Perak, where sending your child to an international school had a median cost of $3,426 in 2025, had the lowest median cost not only in Asia, but also in the world. Furthermore, the highest median cost in Malaysia wasn’t in the capital, Kuala Lumpur - that title goes to Penang, which had a median cost of $7,314 in 2025.
You can find a breakdown of exact prices for each Asian city in the table below. But if Asia isn’t enough, we have also compiled price data for other regions and cities around the world; you can find links to this additional research at the bottom of this article. If you require any further information or have additional questions, don't hesitate to contact us at andrea@international-schools-database.com.