Key points:
- New York City is by far the most expensive city for international education in the Americas, and its school fees are also considerably more expensive than San Francisco.
- International School fees are at least 50% higher in North America than in Central / South America.
- The cheapest international school fees in all of the Americas can be found in Lima, Peru.
At the International Schools Database, we help local and expat parents choose the perfect international school for their children. Our database allows parents to find, research and compare international schools in cities across five continents. Naturally, this means that we gather and analyse a huge amount of information about international schools all over the world.
Starting in 2019, we began using this data to evaluate the prices of international schools across the globe. For 2020 we have expanded this research to include the Americas. In this article, we share and analyze the prices of international schools in the Americas in 2020.
Below, we have analysed price data from 8 cities in 5 countries in the Americas, in graph and table forms. While we have used all price data available to us, there may be additional schools and prices not included in each city. This is because they do not make their price data available or because it is unknown to us. Links to additional research focusing on each world region individually and globally can be found at the bottom of this article.
Prices of International Schools in the Americas, Per Year
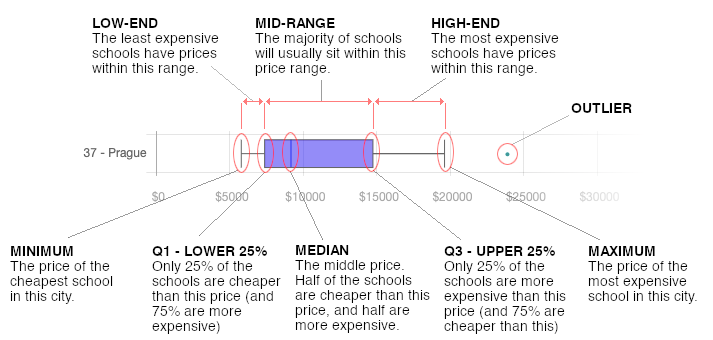
The graph below is known as a box plot graph. It shows a comprehensive view of the range of prices in each city, instead of just an average. A single average price may not necessarily represent the full picture of prices in each destination. Since there is a lot to unpack in this graph, we have also provided a little explanation on how to read the graph easily at the end of the article.
Highlights and takeaways from the research findings
The very broad spectrum of international school prices in this region can at least partially be attributed to the difference in wealth and cost of living between the USA / Canada versus the rest of the Americas.
San Francisco may have a more famous reputation as being an expensive city, but NYC is much more expensive when it comes to international schools. While the most expensive international school fees in San Francisco are $35k per year, in New York it’s much higher at $58k.
Median international school fees are much lower in Central and South America, ranging from just over $8k in Lima to just over $13k in São Paulo. In contrast, median international school prices in the USA range from just under $20k in Chicago to just under $40k in New York.
The costs of international schooling in Central and South America are relatively consistent. The median international school fees range from $8.2k to $13k per year.
You can find a breakdown of exact prices for each American city in the table below. But if the Americas isn’t enough, we have also compiled price data for other regions and cities around the world; you can find links to this additional research at the bottom of this article. If you require any further information or have additional questions, don't hesitate to contact us at andrea@international-schools-database.com.