Home > Articles

The cost of international schools around the world in 2020 revealed

Key points:

  • The 3 most expensive countries in the world for international education are the USA, China and Switzerland.
  • Asia is the most expensive region for international education. 5 of the 10 cities with the most expensive international school fees in the world are located in Asia.
  • Africa is by far the most affordable continent for international schooling.
  • Europe has the widest range of international school fees in the world.

At the International Schools Database, we help local and expat parents choose the perfect international school for their children. Our database allows parents to find, research and compare international schools in cities across five continents. Naturally, this means that we gather and analyse a huge amount of information about international schools all over the world.

Starting in 2019, we began using this data to evaluate the prices of international schools across the globe. In 2019 we compiled price data at regional levels for Asia, Africa, the Middle East and Europe, along with worldwide price trends. For 2020 we have expanded this research even further to include the Americas as well.

Below, we have analysed the worldwide price data from 73 cities in 48 countries, in graph and table forms. While we have used all price data available to us, there may be additional schools and prices not included in each city, because they do not make their price data available or it is unknown to us. Links to additional research focusing in each of the regions individually can be found at the bottom of this article and here can be found the updated research for 2021 and the updated research for 2022.

Worldwide Prices of International Schools Per Year

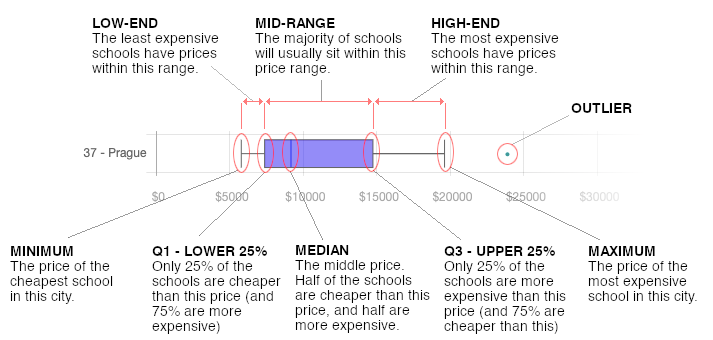
The graph below is known as a box plot graph. It shows a comprehensive view of the range of prices in each city, instead of just an average, as a single average price may not necessarily represent the full picture of prices in each destination. Since there is a lot to unpack in this graph, we have also provided a little explanation on how to read the graph easily at the end of the article.

How to read this graph

Highlights and takeaways from the research findings

Just four countries are represented among the top 10 most expensive cities for international education - USA, China, Switzerland and South Korea. All of the top 10 are cities with notoriously high costs of living, including New York City, San Francisco, Zurich and Shanghai.

African cities are much, much cheaper for international schooling. Casablanca, the most expensive African city for international school fees, ranks only as the 45th most expensive in the world out of a total of 73 cities in our results. The rest of the African cities have cheaper international school fees, ranking below 60. This is a clear indicator that Africa is the most affordable region for international education by far.

Europe has the widest range of international school fees in the world. In our results of 73 cities, European cities appear among both the most expensive and the cheapest cities in the world for international education.

Asia’s domination as the most expensive region in the world for international school fees is mostly due to China, which is notoriously expensive for international schooling. Most other Asian cities have an even spread of expensive, cheap and ‘middle of the road’ international school prices.

On that note, despite having 5 cities within the top 10 most expensive places for international education, Asia also has some more affordable options too. Phnom Penh, Cambodia, for example, is the 3rd cheapest city for international school fees in our database.

You can find a breakdown of exact prices for each city in the table below. But if you’d like even more analysis, we have also compiled price data by region; you can find links to this additional research at the bottom of this article. If you require any further information or have additional questions, don't hesitate to contact us at andrea@international-schools-database.com.

Prices of International Schools Per Year

Rank City Minimum Q1 Median Q3 Maximum
1 New York City $23,000 $33,523 $39,898 $46,850 $58,700
2 Beijing $11,802 $29,872 $35,233 $36,600 $38,974
3 Shanghai $5,163 $21,261 $30,146 $40,315 $43,191
4 San Francisco Bay Area $12,632 $25,545 $29,025 $32,083 $34,980
5 Zurich $8,825 $26,246 $28,092 $30,444 $35,742
6 Lausanne - Vaud $16,233 $18,080 $26,828 $30,955 $41,984
7 Shenzhen $12,438 $21,163 $25,666 $31,645 $36,144
8 Guangzhou $13,547 $19,743 $24,663 $31,280 $48,597
9 Geneva $16,464 $21,899 $24,510 $28,170 $30,697
10 Seoul $8,721 $20,354 $23,455 $27,538 $33,104
11 London $3,990 $13,268 $21,787 $28,148 $38,705
12 Singapore $4,482 $13,587 $21,588 $24,233 $38,517
13 Toronto $10,927 $14,875 $21,508 $25,304 $26,569
14 Chicago, Illinois $5,565 $12,081 $19,623 $31,538 $32,600
15 Brussels $7,789 $13,850 $18,833 $23,658 $39,016
16 Tokyo $5,882 $13,535 $18,805 $22,102 $27,725
17 Hanoi $3,643 $5,762 $18,064 $20,329 $28,435
18 Hong Kong $2,270 $14,937 $16,447 $22,180 $32,287
19 Ho Chi Minh City $5,095 $8,476 $16,162 $19,776 $25,543
20 Taipei $12,631 $14,140 $15,789 $18,105 $29,327
21 Bangkok $2,550 $9,181 $15,060 $20,117 $31,044
22 Milan $4,084 $9,293 $13,613 $17,499 $30,659
23 São Paulo $7,655 $9,686 $13,197 $17,284 $25,045
24 Paris $2,758 $8,116 $13,021 $19,887 $36,519
25 Yangon $3,600 $9,088 $13,000 $21,668 $25,340
26 Frankfurt am Main $4,563 $9,244 $12,911 $16,495 $25,036
27 Jakarta $2,502 $9,272 $12,693 $19,468 $30,029
28 Rome $6,155 $9,071 $12,666 $16,928 $21,248
29 Kyoto-Osaka-Kobe $5,111 $8,896 $12,235 $15,027 $23,337
30 Pattaya $3,914 $8,022 $12,214 $17,110 $18,924
31 Budapest $4,311 $9,562 $12,019 $13,518 $23,700
32 Panama City $2,799 $6,895 $11,289 $13,962 $16,083
33 Vienna $5,966 $6,818 $11,250 $21,487 $24,094
34 Berlin $3,551 $6,416 $11,246 $12,695 $17,875
35 Bratislava $6,002 $8,760 $11,246 $13,140 $18,771
36 Dubai-Sharjah-Ajman $2,317 $5,920 $11,231 $14,874 $26,018
37 Bucharest $4,380 $8,849 $11,068 $14,513 $24,030
38 Manila $2,476 $6,223 $11,050 $16,820 $20,710
39 Lisbon $5,007 $8,494 $11,009 $13,974 $15,421
40 Sofia $5,392 $6,629 $10,890 $11,441 $23,051
41 San Jose $4,159 $9,477 $10,600 $11,015 $19,960
42 Barcelona $4,960 $8,334 $10,276 $12,903 $20,209
43 Doha $1,312 $7,654 $10,217 $12,689 $20,784
44 Athens $5,188 $7,221 $10,180 $12,258 $13,329
45 Casablanca $1,798 $3,710 $10,080 $12,443 $13,435
46 Istanbul $4,500 $6,750 $9,345 $27,250 $34,290
47 Madrid $4,617 $8,239 $9,148 $10,180 $16,687
48 Mallorca $6,132 $8,049 $8,862 $9,517 $11,814
49 Prague $6,395 $7,032 $8,574 $17,766 $24,563
50 Phuket $4,558 $7,167 $8,554 $11,320 $21,169
51 Kuwait City $1,233 $5,564 $8,502 $11,535 $17,985
52 Rotterdam - The Hague $4,439 $6,880 $8,435 $19,488 $28,647
53 Abu Dhabi $2,532 $6,646 $8,331 $12,288 $20,419
54 Lima $4,761 $6,568 $8,271 $11,555 $17,424
55 Warsaw $4,674 $6,718 $7,967 $10,595 $22,639
56 Muscat $1,169 $5,039 $7,791 $11,103 $21,426
57 Johor Bahru $2,923 $5,791 $7,732 $17,174 $20,463
58 Algarve $5,393 $7,102 $7,606 $8,697 $11,719
59 Malaga - Costa del Sol $2,667 $6,201 $7,334 $8,119 $10,062
60 Alicante - Costa Blanca $1,953 $5,204 $7,067 $8,342 $9,920
61 Nairobi $3,793 $5,087 $7,040 $13,841 $29,564
62 Riyadh $1,792 $4,166 $6,956 $9,533 $24,856
63 Valencia $3,255 $6,028 $6,126 $8,340 $9,400
64 Penang $3,508 $5,341 $6,114 $6,813 $9,376
65 Manama $1,002 $3,868 $5,792 $9,313 $20,421
66 Kuala Lumpur $2,492 $4,248 $5,782 $9,379 $23,542
67 Amsterdam $4,084 $5,457 $5,712 $19,023 $29,002
68 Johannesburg $1,127 $4,824 $5,588 $6,733 $28,796
69 Kampala $613 $2,457 $5,565 $7,410 $19,900
70 Addis Ababa $1,600 $3,630 $5,343 $15,376 $25,925
71 Phnom Penh $1,895 $3,625 $5,000 $7,524 $19,941
72 Copenhagen $4,030 $4,226 $4,818 $5,860 $20,069
73 Cape Town $2,079 $3,668 $4,151 $4,420 $5,718

source: www.international-schools-database.com

How to read the graph

The purple box shows the middle portion of the data, known in statistical lingo as the Interquartile Range. This is the ‘ballpark’ range that you would usually expect to pay in that particular city. The horizontal lines at each end of the box represent the First Quartile (Q1) and Third Quartile (Q3). These are the prices that would be considered somewhat cheaper (for Q1) or more expensive (for Q3) than the norm.

The median is shown as a vertical bar in the centre of the box. This is the price of the school in the exact middle of the range, i.e. the half-way point. Finally, you’ll see dots next to some of the box plots. These are ‘outliers’, prices that sit outside of all of the above ranges.

⇧ Go back to the graph ⇧

Additional 2020 research for other regions:

Latest updated research for 2022: